Django: profile memory usage with Memray

Memory usage can be hard to keep under control in Python projects. The language doesn’t make it explicit where memory is allocated, module imports can have significant costs, and it’s all too easy to create a global data structure that accidentally grows unbounded, leaking memory. Django projects can be particularly susceptible to memory bloat, as they may import many large dependencies like numpy, even if they’re only used in a few places.
One tool to help understand your program’s memory usage is Memray, a memory profiler for Python created by developers at Bloomberg. Memray tracks where memory is allocated and deallocated during program execution. It can then present that data in various ways, including spectucular flame graphs, collapsing many stack traces into a chart where bar width represents memory allocation size.
Profile a Django project
Memray can profile any Python command with its memray run command. For a Django project, I suggest you start by profiling the check management command, which loads your project and then runs system checks. This is a good approximation of the minimum work required to start up your Django app, imposed on every server load and management command execution.
To profile check, run:
$ memray run manage.py check
Writing profile results into memray-manage.py.4579.bin
System check identified no issues (0 silenced).
[memray] Successfully generated profile results.

You can now generate reports from the stored allocation records.
Some example commands to generate reports:

/.../.venv/bin/python3 -m memray flamegraph memray-manage.py.4579.bin
The command completes as normal, outputting System check identified no issues (0 silenced).. Around that, Memray outputs information about its profiling, saved in a .bin file featuring the process ID, and a suggestion to follow up by generating a flame graph.
The flame graph is great, so go ahead and make it:
$ memray flamegraph memray-manage.py.4579.bin
Wrote memray-flamegraph-manage.py.4579.html
The result is a .html file you can open in your browser, which will look something like this:
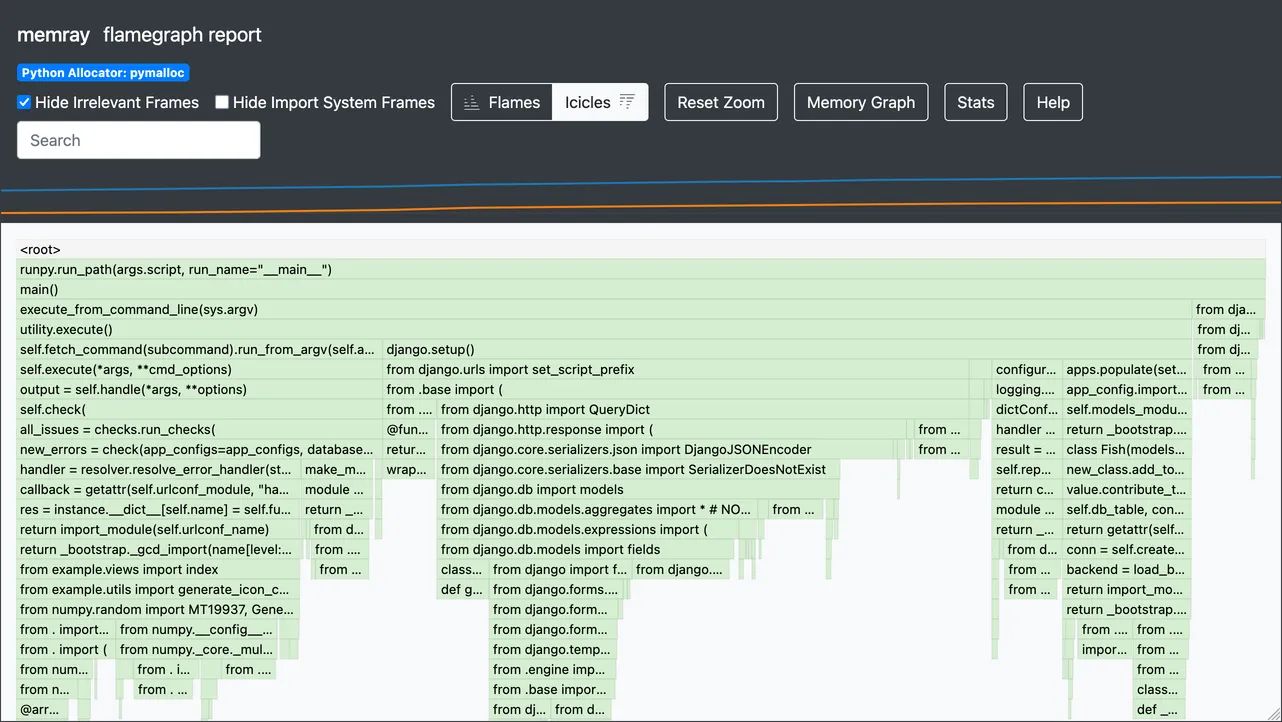
The header of the page contains some controls, along with a mini graph tracking resident and heap memory over time. Underneath it is the main flame graph, showing memory allocations over time.
By default, the graph is actually an “icicle” graph, with frames stacked downward like icicles, rather than upward like flames. This matches Python’s stack trace representation, where the most recent call is at the bottom. Toggle between flame and icicle views with the buttons in the header.
The Stats button at the top opens a dialog with several details, including the peak memory usage:

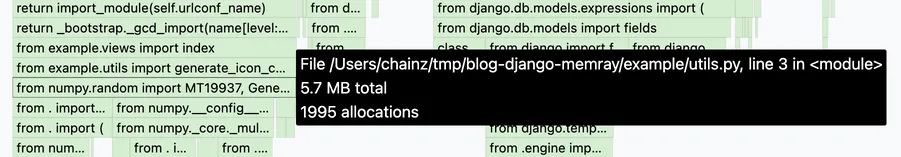
Frames in the graph display the line of code running at the time, and their width is proportional to the amount of memory allocated at that point. Hover a frame to reveal its details: filename, line number, memory allocated, and number of allocations:
Make an improvement
In the above example, I already narrowed in on a potential issue. The line from numpy.random import ... allocates 5.7 MB of memory, about 23% of the peak usage of 25.2 MB. This import occurs in example/utils.py, on line 3. Let’s look at that code now:
from colorsys import hls_to_rgb

from numpy.random import MT19937, Generator


def generate_icon_colours(number: int) -> list[str]:
    """
    Generate a list of distinct colours for the given number of icons.
    """
    colours = []
    for i in range(number):
        hue = i / number
        lightness = 0.5
        saturation = 0.7

        rgb = hls_to_rgb(hue, lightness, saturation)
        hex_colour = "#" + "".join(f"{int(c * 255):02x}" for c in rgb)
        colours.append(hex_colour)

    Generator(MT19937(42)).shuffle(colours)

    return colours
The code uses the Generator.shuffle() method from numpy.random to shuffle a list of generated colours. Since importing numpy is costly, and this colour generation is only used in a few code paths (imagine we’d checked), we have a few options:
Delete the code—this is always an option if the function isn’t used or can be replaced with something simpler, like pregenerated lists of colours.
Defer the import until needed, by moving it within the function:
def generate_icon_colours(number: int) -> list[str]:
    """
    Generate a list of distinct colours for the given number of icons.
    """
    from numpy.random import MT19937, Generator

    ...
Doing so will avoid the import cost until the first time the function is called, or something else imports
numpy.random.Use a lazy import:
lazy from numpy.random import MT19937, Generator

def generate_icon_colours(number: int) -> list[str]:
    ...
This syntax should become available from Python 3.15 (expected October 2026), following the implementation of PEP 810. It makes a given imported module or name only get imported on first usage.
Until it’s out, an alternative is available in
wrapt.lazy_import(), which creates an import-on-use module proxy:from wrapt import lazy_import npr = lazy_import("numpy.random") def generate_icon_colours(number: int) -> list[str]: ... npr.Generator(npr.MT19937(42)).shuffle(colours) ...
Use a lighter-weight alternative, for example Python’s built-in
random.shuffle()function:import random ... def generate_icon_colours(number: int) -> list[str]: ... random.shuffle(colours) ...
In this case, I would go with option 4, as it avoids the heavy numpy dependency altogether, will provide almost equivalent results, and doesn’t need any negotiation about changing functionality. We will see an improvement in startup memory usage as long as no other startup code path also imports numpy.random.
After making an edit, re-profile and look for changes:
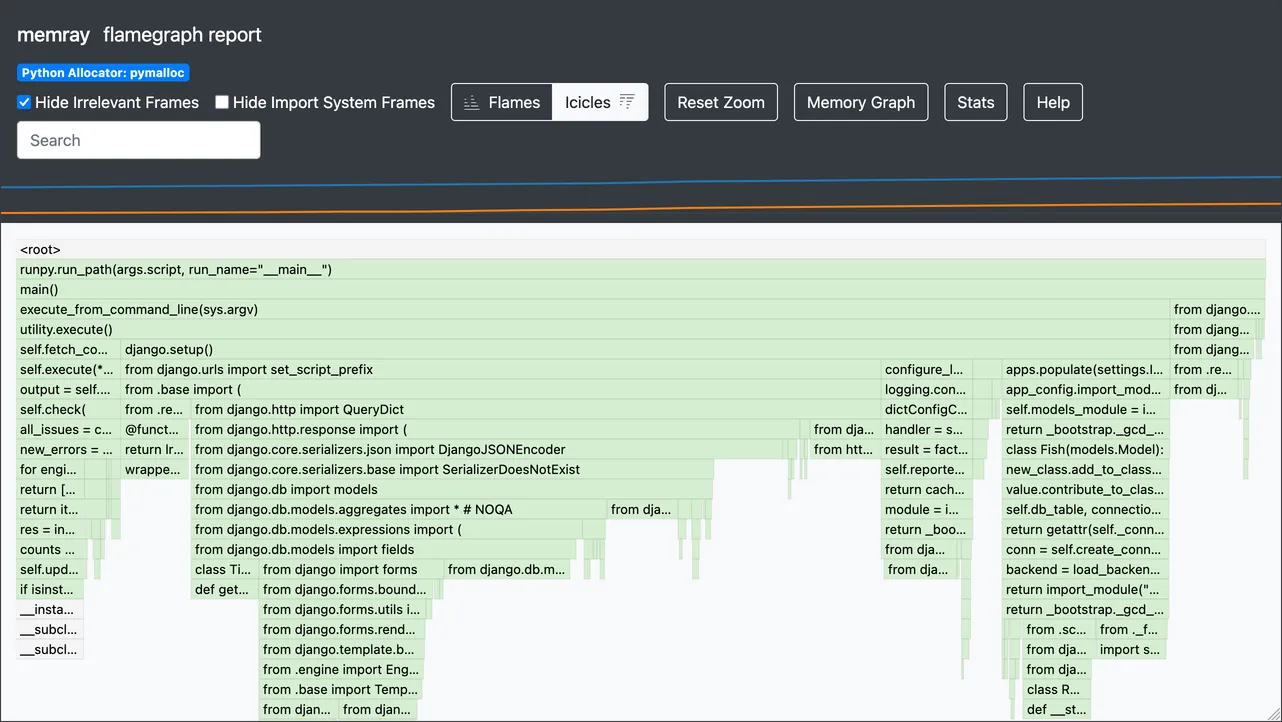
In this case, it seems the change worked and memory usage has reduced. The flame graph looks like the right ~75% of the previous one, with “icicles” for regular parts of Django’s startup process, such as importing django.db.models and running configure_logging(). And the Stats dialog shows a lower peak value.
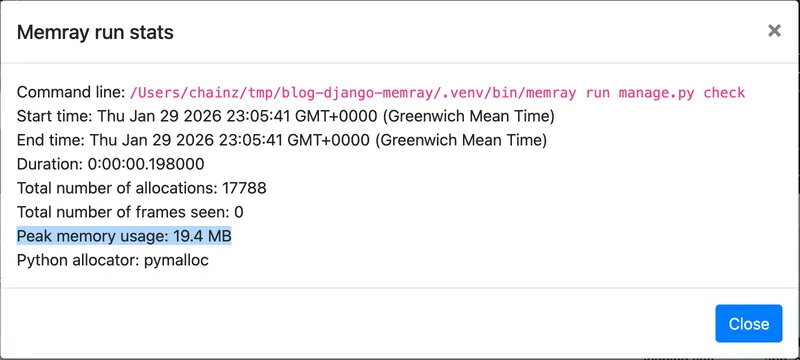
A drop from 25.2 MB to 19.4 MB, or 22% overall reduction!
(If the change hadn’t worked, we would probably have revealed another module that is loaded at startup and imports numpy.random. Removing or deferring that import could then yield the saving.)
A Zsh one-liner to speed up checking results
If you use Zsh, you chain memray run, memray flamegraph, and opening the HTML result file with:
$ memray run manage.py check && memray flamegraph memray-*.bin(om[1]) && open -a Firefox memray-flamegraph-*.html(om[1])
This can really speed up doing multiple iterations measuring potential improvements. I covered the (om[1]) globbing syntax in this previous Zsh-specific post.
😸😸😸 Check out my new book on using GitHub effectively, Boost Your GitHub DX! 😸😸😸
One summary email a week, no spam, I pinky promise.
Related posts:
- Zsh: select generated files with
(om[1])glob qualifiers - Django: what’s new in 6.0
- Django: How to profile and improve startup time
Tags: django