Python: introducing profiling-explorer

I’ve made another package! Like icu4py, which I made in February, it was sponsored by my client Rippling. And like tprof, which I made in January, it’s a profiling tool!
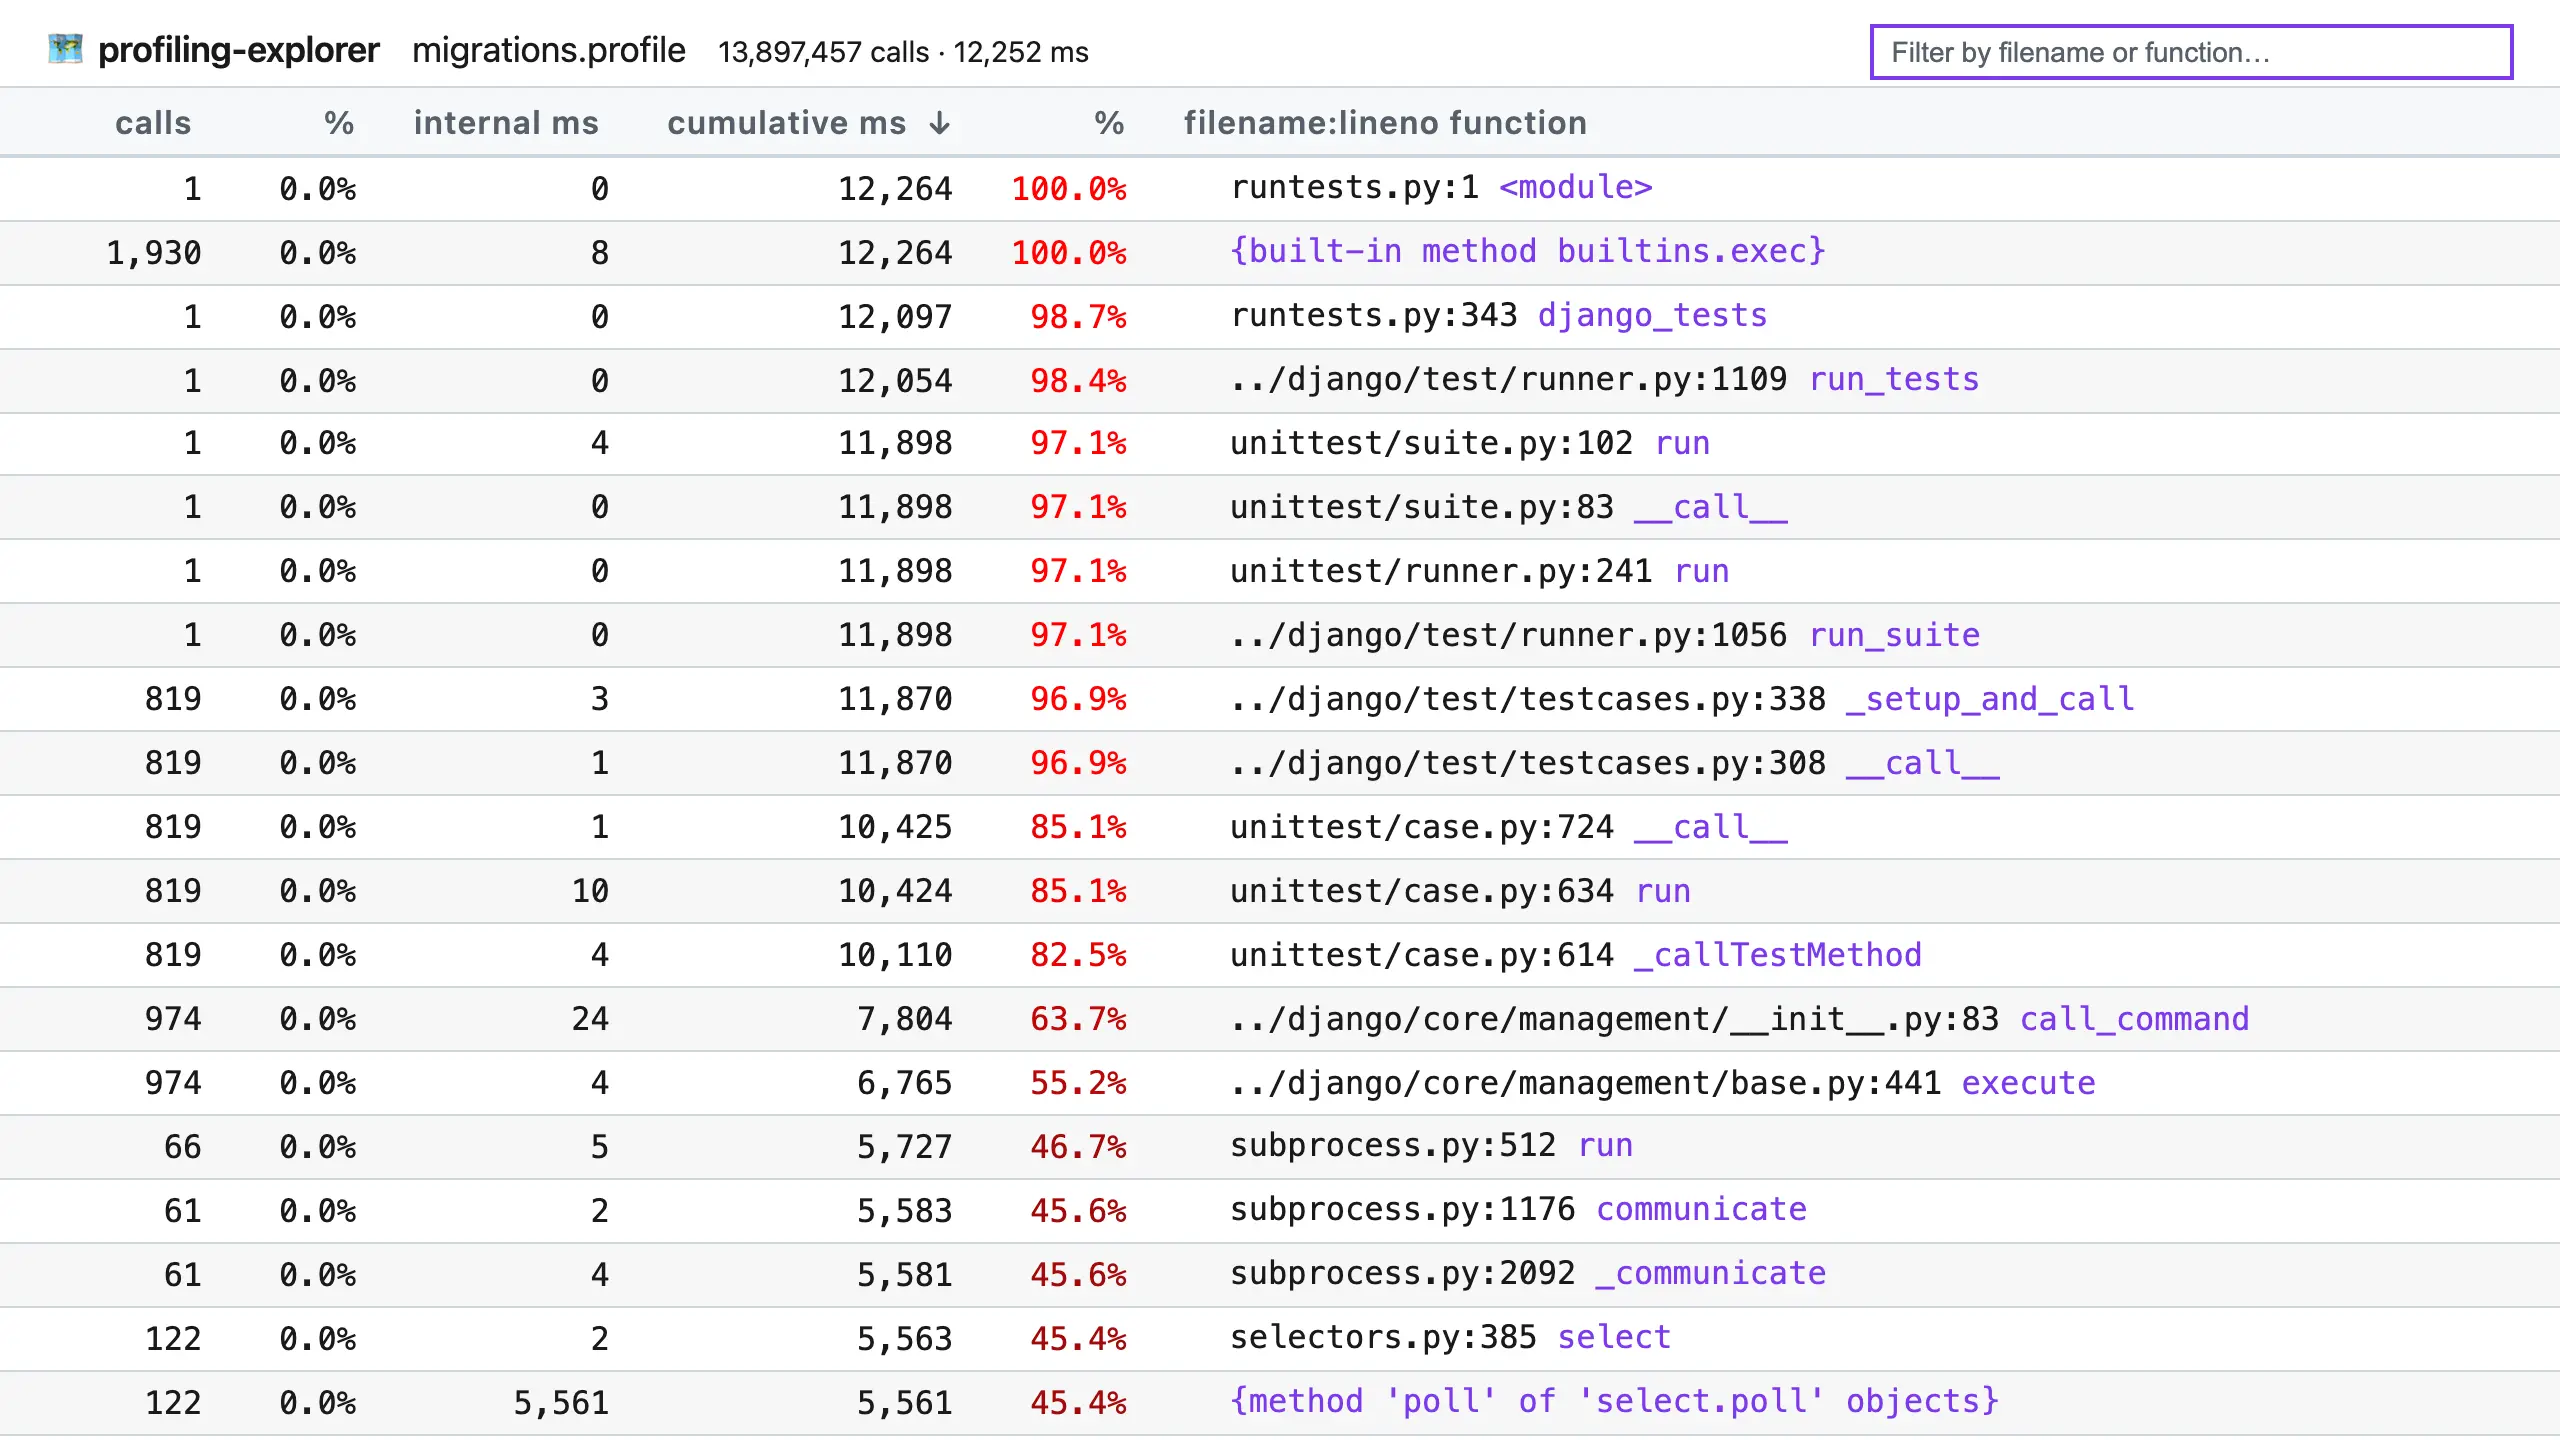
profiling-explorer is a tool for exploring profiling data from Python’s built-in profilers, which are stored in pstats files. Here’s a screenshot of it in action, displaying profiling data from running a subset of Django’s test suite:
(Click to enlarge.)
The table copies the pstats interface, with functions in the right-hand column and stats about them in columns to the left. However, it has some differences, such as using improved column names and always displaying times in milliseconds, and it comes with these features:
- Dark mode (sorry for the blinding screenshot!).
- Click the calls, internal ms, or cumulative ms column headers to sort by that column.
- Use the search box to filter by filename or function name.
- Hover by a filename + line number pair to reveal the copy button, which copies the location to your clipboard for faster opening.
- Click the callers or callees links on the right of a row (not pictured above) to see the callers or callees of that function.
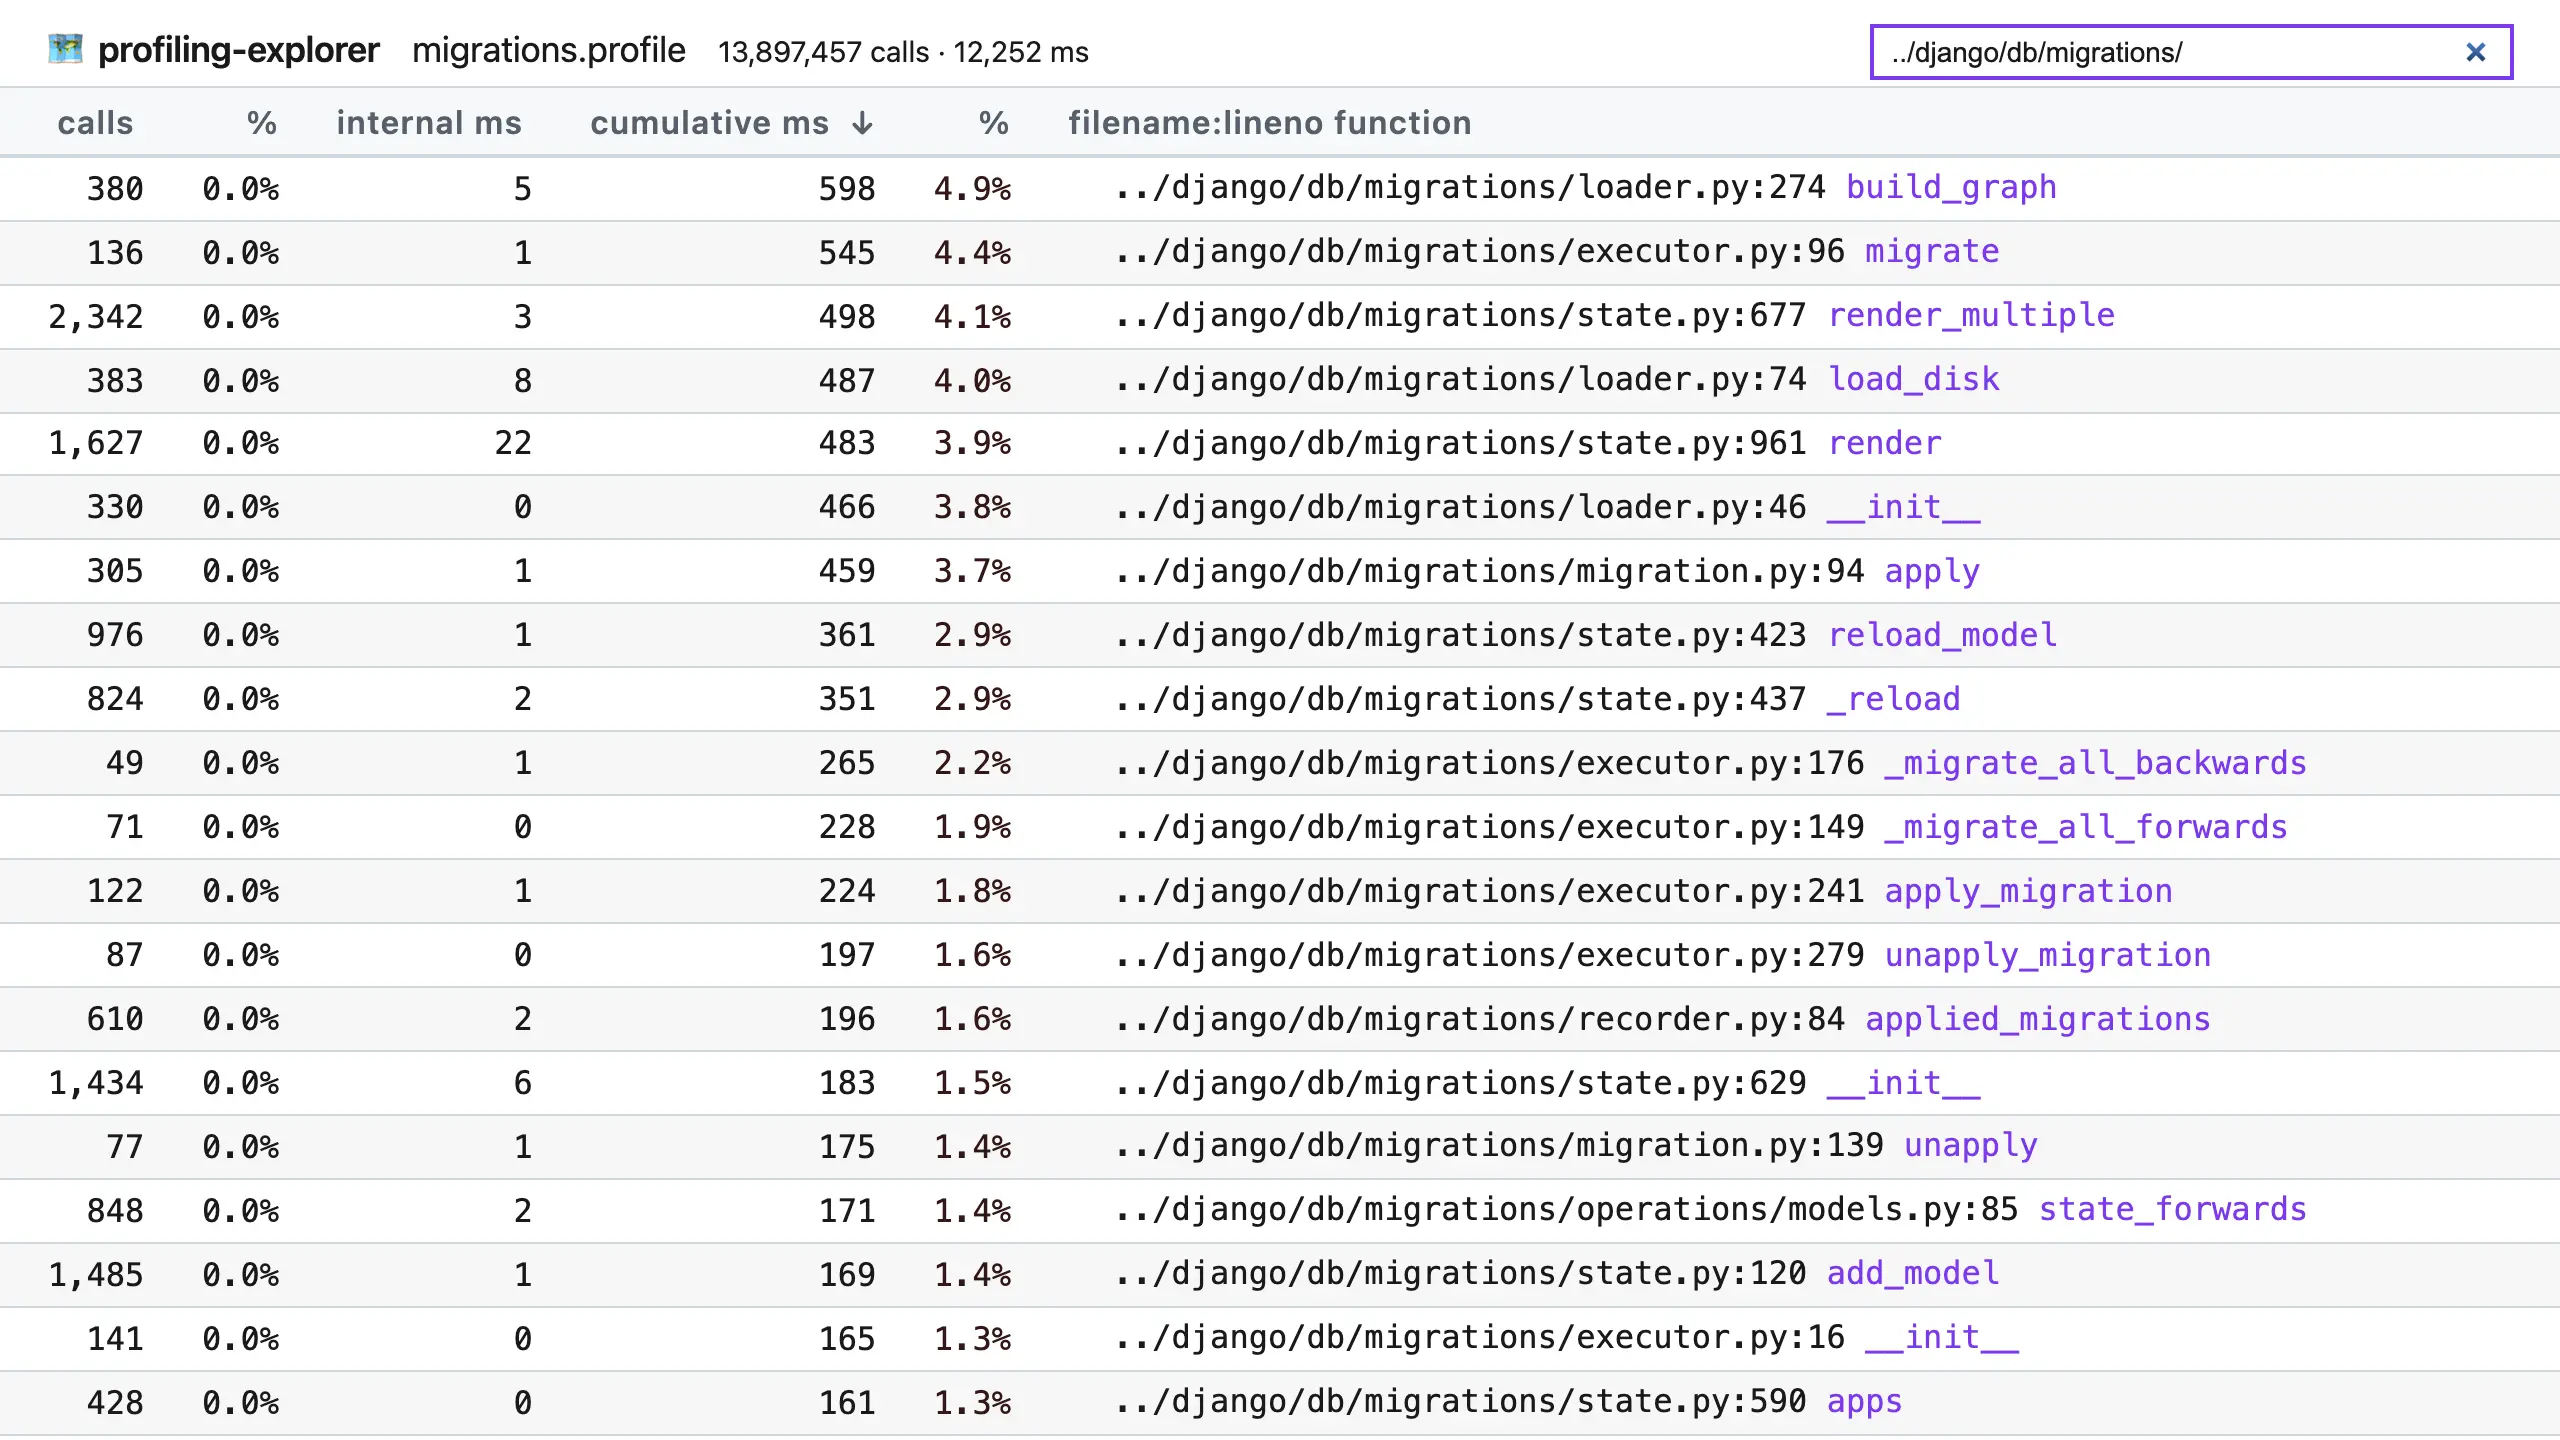
For example, if I put ../django/db/migrations/ in the filter box, I can limit the table to just functions in Django’s migration system, which could be useful for optimizing that system:
(Click to enlarge.)
profiling-explorer was motivated by doing lots of optimization work, at Rippling, in Django, and elsewhere. I’ve often used Python’s pstats to inspect profiling data, but I’ve found its command line interface clunky and slow. Visualization tools like gprof2dot can help, but they don’t provide the immediacy of a table interface, where many numbers can be skimmed and compared at a glance.
Python’s built-in profilers
It’s also a great time for profiling in Python, as version 3.15 (expected October 2026) will introduce a new built-in profiler, bringing the total to three. Here’s a quick list explaining their history…
profile- introduced by Guido van Rossum in 1992 (commit), this module provides a simple profiler for Python code, using a tracing approach that records timings for every function call and return. However, because it’s implemented purely in Python, it adds a heavy overhead which slows down profiling and skews results, and as such it’s deprecated for removal in Python 3.17.profiling.tracing(previouslycProfile) - this module was built as a C re-implementation ofprofileby Armin Rigo in 2006 (commit). Being written in C, it has a much lower overhead thanprofile, and it has served developers for years. Still, it does make programs run ~50% slower, and since overhead is per-function, it can make oft-called functions look like more of a bottleneck than they really are.profiling.sampling(“Tachyon”) - new in Python 3.15, thanks to Pablo Galindo Salgado (commit), this profiler uses a sampling approach, which means it periodically interrupts the profiled program to record the current call stack. This is a very low overhead approach, meaning programs can run at nearly full speed, and the skew from per-function overhead is gone. For compatibility, it uses the same pstats file format as the other profilers, allowing profiling-explorer to work with it out of the box. That said, it can also output several visualization formats, like flame graphs and heat maps, making it very versatile.I find Tachyon a very exciting addition to Python, and I cannot wait to use it more. Previously, we’ve needed to turn to third-party sampling profilers, like py-spy, which is great but presents some difficulties, such as needing sudo permissions and ongoing maintenance to keep up with Python changes. Having a “batteries included” sampling profiler will make it a lot easier to accurately trace programs.
For more information, check out:
- the rewritten profiling documentation
- The Core.py podcast episode where Pablo and Łukasz Langa discuss the design and implementation.
Give it a try
Future hype aside, profiling-explorer is useful whatever (supported) Python version you’re currently using. To get started, first generate a pstats file for your program by running it under profiling.tracing, under its old name cProfile, with:
$ python -m cProfile -o <name>.pstats <program>
<program> can be a Python file, or -m with a module name, and further arguments are passed to the program.
For example, to profile Django’s system check command, you can run:
$ python -m cProfile -o check.pstats manage.py check
Or, to profile a set of tests under pytest, you can run:
$ python -m cProfile -o tests.pstats -m pytest example/tests/test_rocket.py
Once you have a pstats file, pass it to profiling-explorer. If you use uv, this is as easy as:
$ uvx profiling-explorer <name>.pstats
Otherwise, install profiling-explorer and invoke it directly:
$ profiling-explorer <name>.pstats
However you start it, you’ll see:
$ uvx profiling-explorer migrations.profile
profiling-explorer running at http://127.0.0.1:8099/
Press CTRL+C to quit.
Opening in web browser…
…and your browser will open the interface automatically.
Happy exploring, I hope you find some easy-to-fix bottlenecks!
Fin
Thanks again to Rippling for sponsoring this development. Several of us are already using profiling-explorer on their giant Django code base to find useful optimizations. If you’re looking for your next opportunity, and feel smart and ready to go after hard problems on day one, check out Rippling’s open roles.
May you always be improving,
—Adam
😸😸😸 Check out my new book on using GitHub effectively, Boost Your GitHub DX! 😸😸😸
One summary email a week, no spam, I pinky promise.
Related posts:
- Python: introducing tprof, a targeting profiler
- Python: Profile a section of code with cProfile
- Python: a quick cProfile recipe with pstats
- Django: How to profile and improve startup time
Tags: python